2020.10.20 コラム
【API・データ検証奮闘記】#2.天気 APIやってみた
本コラムでは、APIやデータに関連する言語などを無邪気に触ってみた備忘録として、ライトに記載していきます! (連載記事はこちら)
「ちょっと違くない」「他にいい方法あるのに」といったご意見もあるかと思いますが、何卒お手柔らかに!!
<プロフィール>
富松 良介
2017年、株式会社サイバー・コミュニケーションズ(CCI)入社。Oracle Bluekai・Treasure Data等のDMPや、AWS・GCP等のPublicCloud領域を担務。2019年6月よりデータの利活用を推進するコンサルティング会社「株式会社DataCurrent」に出向し、事業会社の基盤構築・運用や自社ソリューション開発を担当。
●天気 APIやってみた
天気APIのデータを使ってトレンドの分析に活用することができないか考えました。
天気データ取得の過程から、天気データと 特定キーワードに関連するトレンドデータ をどう活用したかについてご紹介致します。
| API名 | 天気 API ※詳細 日本気象協会の天気APIは、予報や実績、その他指数データ等がございます。 https://www.jwa.or.jp/service/others/others-01/ |
| 費用 | 要問合せ |
●ステップ1. まずは天気 APIを叩いてみた
早速Pythonで天気実績データを取得してみる。
import os
import sys
import pandas as pd
import requests
import json
import time

api_token = "*************"
api_key = "**************"
pointcodes_group = "32091|32096|32111|32126|32136"

date_from = "2020/08/31 00:00"
date_to = "2020/08/31 23:00"

def get_weather_observation(date_from, date_to, point_codes):

    endpoint_url = "https://hogehoge.com/hoge/hoge?"
    payload = {
        "api_key": api_key,
        "api_token": api_token,
        "date_from": date_from,
        "date_to": date_to,
        "point_codes": point_codes
    }
    headers = {
        "Content-Type": "application/x-www-form-urlencoded",
        "Accept": "application/json"
    }
    try:
      res = requests.post(endpoint_url, data = payload, headers = headers, timeout=(1800.0, 180.5))
      res_json =  json.loads(res.content)
      status = res_json['code']
    except:
      return None

    if status == '200':
      results_json = res_json['points']
    else:
      results_json = None

    return results_json


def json_to_flat(json_list):
  flat_amedas_data = []
  flat_chijyou_data = []
  for i in range(len(json_list)):
    points_json = json_list[i]
    for j in range(len(points_json['dates'])):
      dates_json = points_json['dates'][j]
      for k in range(len(dates_json['observation']['amedas_data'])):
        amedas_json = dates_json['observation']['amedas_data'][k]
        flat_amedas_data.append([
            points_json['point'],
            dates_json['date'],
            amedas_json['delivery_time'],
            amedas_json['sixtymin_precip'],
            amedas_json['sixtymin_precip_num_acum'],
            amedas_json['sixtymin_sunshine'],
            amedas_json['snow_depth'],
            amedas_json['temp'],
            amedas_json['tenmin_precip'],
            amedas_json['tenmin_sunshine'],
            amedas_json['total_precip'],
            amedas_json['total_precip_elapsed_time'],
            amedas_json['total_sunshine'],
            amedas_json['total_sunshine_elapsed_time'],
            amedas_json['wind_compass_direction'],
            amedas_json['wind_direction'],
            amedas_json['wind_speed']
        ])

      for l in range(len(dates_json['observation']['chijyou_data'])):
        chijyou_json = dates_json['observation']['chijyou_data'][l]
        flat_chijyou_data.append([
            points_json['point'],
            dates_json['date'],
            chijyou_json['ceiling'],
            chijyou_json['cloud_cover'],
            chijyou_json['delivery_time'],
            chijyou_json['discomfort_index'],
            chijyou_json['dist_from_amedas'],
            chijyou_json['dp_temp'],
            chijyou_json['high_clouds'],
            chijyou_json['humidity'],
            chijyou_json['low_clouds'],
            chijyou_json['max_temp_in_12h'],
            chijyou_json['middle_clouds'],
            chijyou_json['min_temp_in_12h'],
            chijyou_json['pressure_change'],
            chijyou_json['pressure_change_trend'],
            chijyou_json['sea_level_pressure'],
            chijyou_json['snow_fall'],
            chijyou_json['snow_fall_ref_period'],
            chijyou_json['station_pressure'],
            chijyou_json['swell_direction'],
            chijyou_json['swell_scale'],
            chijyou_json['total_cloud_cover'],
            chijyou_json['visibility'],
            chijyou_json['wave_height'],
            chijyou_json['wave_period'],
            chijyou_json['wave_scale'],
            chijyou_json['weather'],
            chijyou_json['weather2']
        ])

  return flat_amedas_data, flat_chijyou_data


def list_to_dataframe(amedas_list,chijyou_list):
  amedas_df = pd.DataFrame(
    amedas_list,
    index=None,
    columns=['point_codes',
            'date',
            'delivery_time',
            'sixtymin_precip',
            'sixtymin_precip_num_acum',
            'sixtymin_sunshine',
            'snow_depth',
            'temp',
            'tenmin_precip',
            'tenmin_sunshine',
            'total_precip',
            'total_precip_elapsed_time',
            'total_sunshine',
            'total_sunshine_elapsed_time',
            'wind_compass_direction',
            'wind_direction',
            'wind_speed'
          ])

  chijyou_df = pd.DataFrame(
    chijyou_list,
    index=None,
    columns=['point_codes',
            'date',
            'ceiling',
            'cloud_cover',
            'delivery_time',
            'discomfort_index',
            'dist_from_amedas',
            'dp_temp',
            'high_clouds',
            'humidity',
            'low_clouds',
            'max_temp_in_12h',
            'middle_clouds',
            'min_temp_in_12h',
            'pressure_change',
            'pressure_change_trend',
            'sea_level_pressure',
            'snow_fall',
            'snow_fall_ref_period',
            'station_pressure',
            'swell_direction',
            'swell_scale',
            'total_cloud_cover',
            'visibility',
            'wave_height',
            'wave_period',
            'wave_scale',
            'weather',
            'weather2'
          ])
  merge_df = pd.merge(amedas_df, chijyou_df, on=['point_codes', 'date', 'delivery_time'], how='left')
  return merge_df


def main():
  result_flat_amedas_list = []
  result_flat_chijyou_list = []
  pointcodes_list = pointcodes_group.split('|')
  for point_codes in (pointcodes_list):
    result_json = get_weather_observation(date_from, date_to, point_codes)
    if result_json is not None:
      amedas_list,chijyou_list = json_to_flat(result_json)
      result_flat_amedas_list.extend(amedas_list)
      result_flat_chijyou_list.extend(chijyou_list)
      result_df = list_to_dataframe(result_flat_amedas_list,result_flat_chijyou_list)
  return result_df

if __name__ == '__main__':
  main()
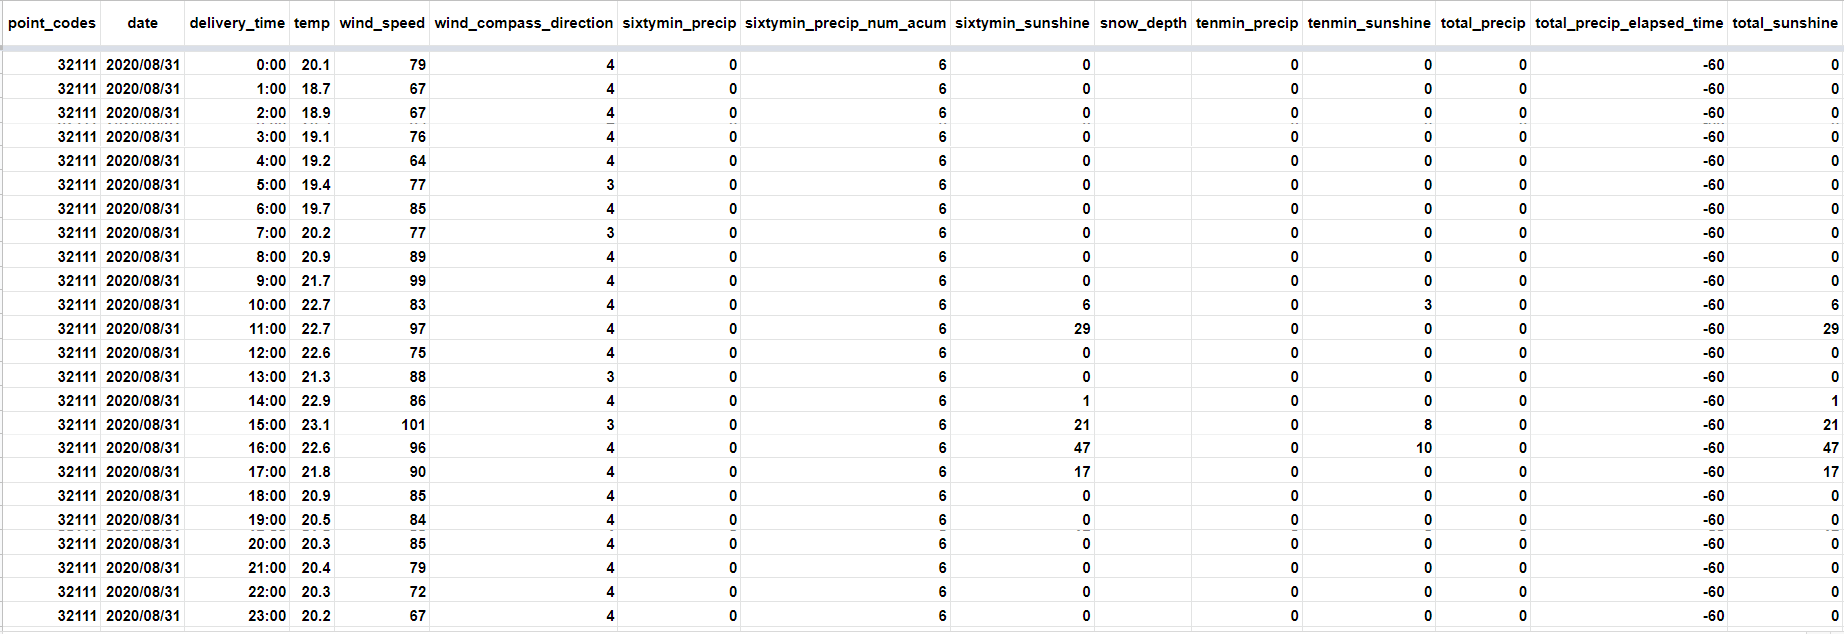
取得結果
観測地点コード毎の時間別天気データが取得できました。
天気実績データは、気温や風向、湿度等 43項目が用意されています。
※観測地点コードは、天気を観測する気象台及び観測所毎に割り振られる番号です。
●ステップ2. 詳しい人に突撃してみた
今回は比較的にスムーズに進みました!

●ステップ3. アウトプットしてみた
天気実績データとYahoo! DS.INSIGHTでそれぞれ「ビアガーデン」に関連する日別データを取得し、気温と検索量で何か傾向がないかみてみました。
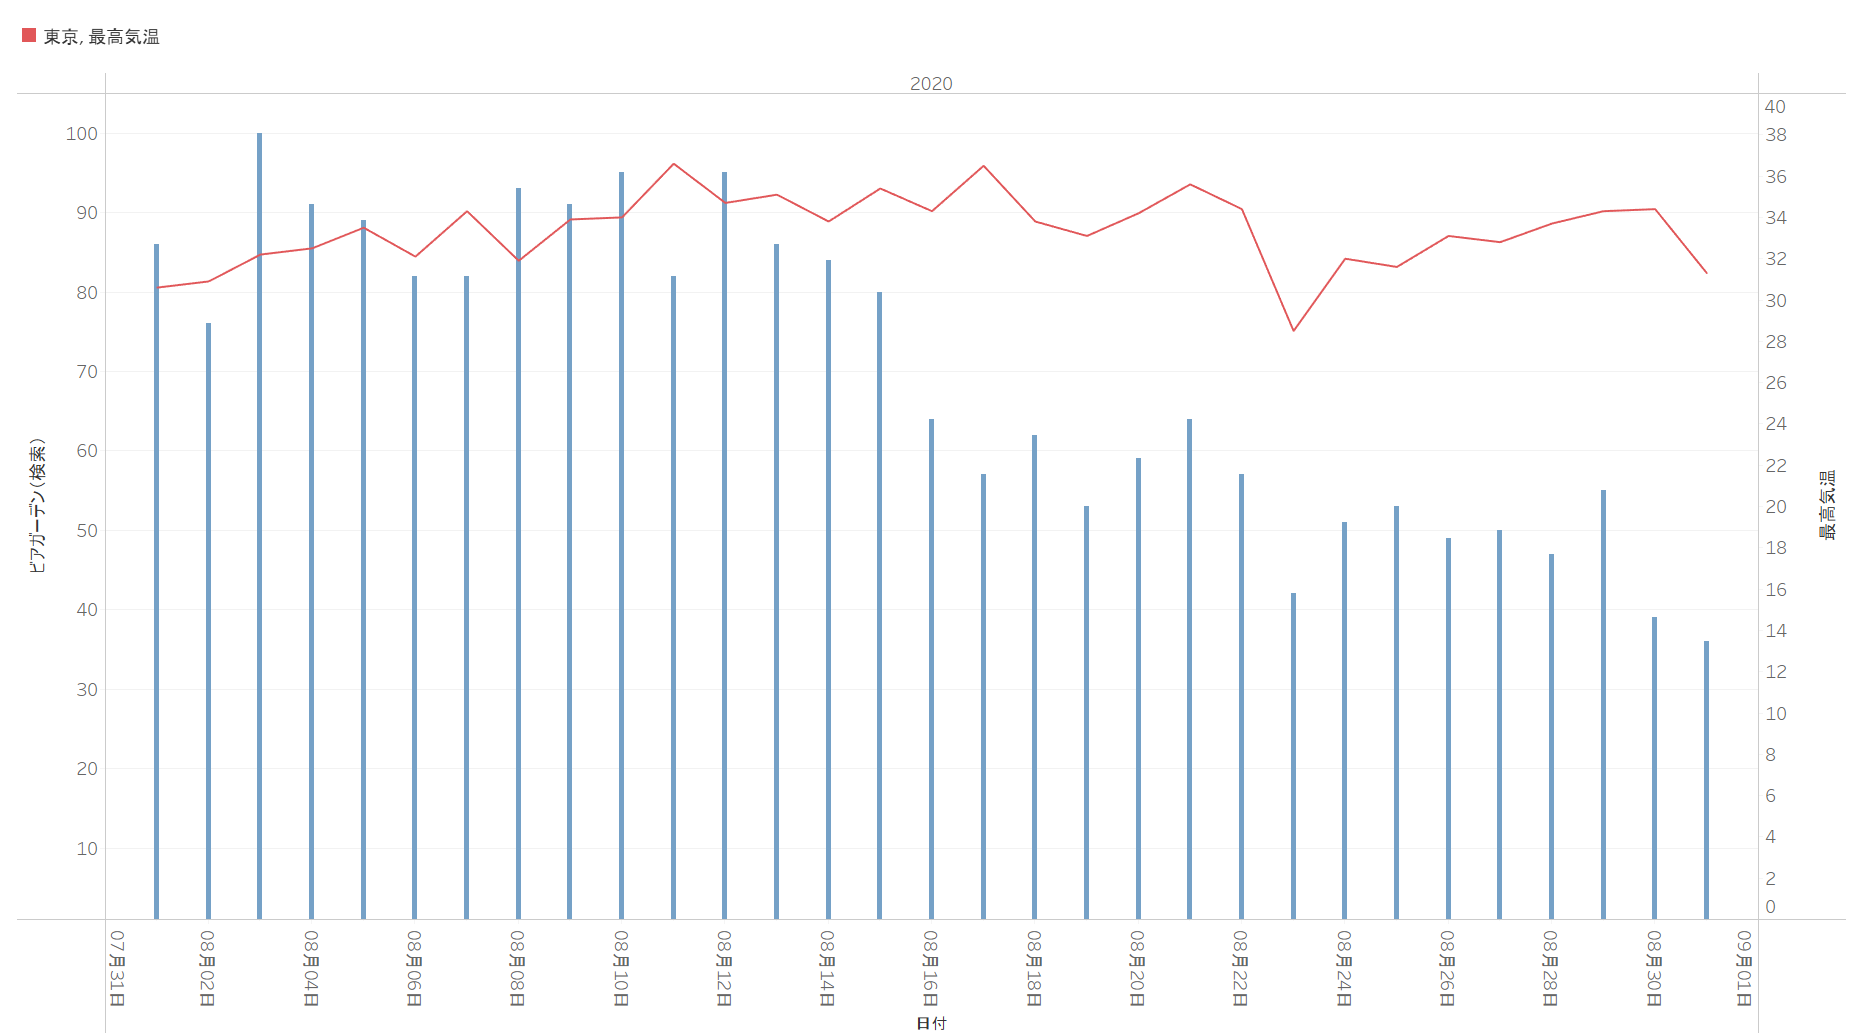
今回は、千代田区の北の丸公園にある「東京管区気象台」の気温を使いました。
結果をみてみると、
検索量は八月のお盆以降から下降傾向で、
23日に気温が下がったタイミングでは検索量も一緒に下がっていることが分かります。
●最後に
弊社では、定点的なリサーチやトレンドの分析をおこなっています。性別や年代等の属性を検索トレンドのダッシュボード提供等様々なパッケージをご用意しておりますので、お気軽にお問い合わせください。
本データに関するお問い合わせは下記にて承ります。
株式会社DataCurrent
info@datacurrent.co.jp